AND Function (Functions in Excel)
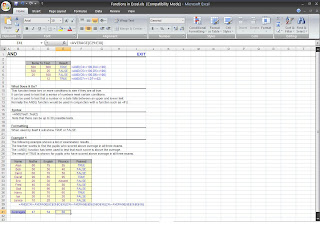
Items To Test | Result | ||
500 | 800 | TRUE | =AND(C4>=100,D4>=100) |
500 | 25 | FALSE | =AND(C5>=100,D5>=100) |
25 | 500 | FALSE | =AND(C6>=100,D6>=100) |
12 | TRUE | =AND(D7>=1,D7<=52) |
What Does It Do? |
This function tests two or more conditions to see if they are all true. |
It can be used to test that a series of numbers meet certain conditions. |
It can be used to test that a number or a date falls between an upper and lower limit. |
Normally the AND() function would be used in conjunction with a function such as =IF(). |
Syntax |
=AND(Test1,Test2) |
Note that there can be up to 30 possible tests. |
Formatting |
When used by itself it will show TRUE or FALSE. |
Example 1 |
The following example shows a list of examination results. |
The teacher wants to find the pupils who scored above average in all three exams. |
The =AND() function has been used to test that each score is above the average. |
The result of TRUE is shown for pupils who have scored above average in all three exams. |
Name | Maths | English | Physics | Passed | |
Alan | TRUE | ||||
Bob | 50 | 30 | 40 | FALSE | |
Carol | 60 | 70 | 50 | FALSE | |
David | 90 | 85 | 95 | TRUE | |
Eric | 20 | 30 | Absent | FALSE | |
Fred | 40 | 60 | 80 | FALSE | |
Gail | 10 | 90 | 80 | FALSE | |
Harry | 80 | 70 | 60 | TRUE | |
Ian | 30 | 10 | 20 | FALSE | |
Janice | 10 | 20 | 30 | FALSE | |
=AND(C38>=AVERAGE($C$29:$C$38),D38>=AVERAGE($D$29:$D$38),E38>=AVERAGE($E$29:$E$38)) | |||||
Averages | 47 | 54 | 60 |


0 comments:
Post a Comment