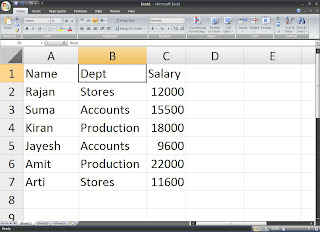
The following data has been entered in a Excel worksheet
Based on these values, write steps to
a) Arrange the data in the order of Dept and further in the order of Name.
Select Range of cells A4:C10 .
Click on data tab, in data tab click on click SORT ,sort dialog box appears then click on sort by select DEPT and click on COPY LEVEL and in THEN BY click on Name column and click OK button.
b) To display only those rows where salary is above Rs.15000 .
Select entire table, click on DATA tab, in data tab click on FILTER in sort and filter group.
Now drop downs arrows appear on each column.
Click on drop down arrow of salary column.
Click on Number filters ,select ‘greater than’ option now custom auto filter dialog box appears and now enter 15000 And click on Ok.
c) To display all the rows except the ‘STORES’ dept.
Select entire table, click on DATA tab, in data tab click on FILTER in sort and filter group.
Now drop downs arrows appear on each column.
Click on drop down arrow of dept column and unselect ‘stores’.
Related Posts by Categories
Excel Problem Write steps to assign Rank and Compute Bonus using VLOOKUP() function in Excel-2007 To compute letter grade using VLOOKUP( ) function in Excel-2007 How to create Pivot table with different example. (To summarize the data using pivot table) To calculate result as “Fail” when percentage of marks (PER) is less than 35, otherwise “Pass”. To compute income tax in Excel-2007 To compute DA. To compute HRA. To compute PF. To compute GROSS PAY. To compute column total. To find highest gross. To find LEAST gross. To find NO. OF ROWS WHERE BASIC PAY IS LESS THAN 20000 (Excel-2007) To find the total marks of each student . To arrange the worksheet in descending order of total marks and further in the alphabetical order of names. To display those rows where the total marks are above 450. (Excel-2007) To find total sales for each city. To construct column chart for First Quarter and Fourth Quarter sales for all cities. To construct Pie chart of Total Sales. (Excel-2007) To find annual production in column F. To draw column chart of production of Rice & Wheat for 4 years. To draw PIE chart for the production of Year 2002. (Excel-2007) To create a straight-line chart. To construct 3-D pie diagramTo draw Bar diagram for total pass in Excel-2007 Write steps to calculate total tax payable by the individuals at the following rate showing income tax, surcharge and total tax in column C, D & E respectively:Surcharge is to be calculated at 10% on the income tax only if the Income exceeds Rs.5 lakhs. (Excel-2007) Explain how to calculate the result in 8th column, a student is declared ‘PASS’ if he gets 40 or more in each subject or the average of marks is 50 or more, otherwise result is ‘FAIL’.(Excel-2007) Give steps to compute HRA at @20% of basic pay or Rs.3000 whichever is less, and DA is 70% of basic pay rounded to nearest 10 in column C and D respectively.(Excel-2007) Write steps to construct the following charts to display year along X Axis and sales of the two depots along Y Axis: (a) A 3-D column chart (b) A Line chart with column series (Excel-2007) Write steps to calculate the Simple Interest using what if Table for the following interest rates (Column input) and terms (Row input) (Excel-2007) Assign letter Grade in Column F using the following policy in Excel-2007 Find Average of highest scoring in two tests (Excel-2007) Explain the steps to create two way data table for maturity amount and Interest for the table in cells A1:B5. (Excel-2007) Write steps to compute depreciation using reducing balance method or written down value method or Diminishing balance method in Excel-2007 Write steps to compute Depreciation using straight line method or approach or Fixed Instalment method or Original Cost Method in Excel-2007 The following worksheet shows Account no. , Name, Deposit amount, yearly rate of interest and no. of years of deposit. Assuming that the amount is compounded annually ,write steps to compute maturity amount in column F .(Excel Problems) The following worksheet shows Account no. , Name, Deposit amount, yearly rate of interest and no. of days of deposit. Write steps to compute simple interest in column E assuming 365 day year. (Excel Problems) The following worksheet shows Product Name ,Unit cost and % of profit in columns A ,B and C. Write steps to compute selling price in column D. (Excel Problems) The following worksheet shows Product Name ,Unit cost in columns A and B. Write steps to compute selling price in column C when profit percentage is entered in cell D9. (Excel Problems)
0 comments:
Post a Comment